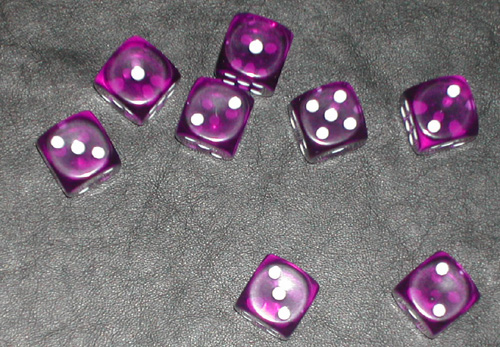
Sitting here on the calendar between Chinese New Year and Saint Patrick’s Day, it seemed like a good time for the sprogs to do some investigations of gambling devices — in particular, dice.
 Dr. Free-Ride: Will you roll dice for me?
Younger offspring: Can I use the purple ones?
Dr. Free-Ride: Sure. Hey, we’re going to roll 36 times. Before we start rolling, can you make some guesses about how many of your rolls will come up as sixes?
Younger offspring: Ummm … I think three.
Dr. Free-Ride: Really? How many do you think will come up as fives?
Younger offspring: I don’t really know. I need to roll to find out how many will come up each number. I don’t know ahead of time.
Dr. Free-Ride: Fair enough.
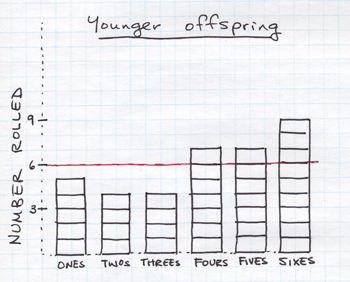
(The results of the younger Free-Ride offspring’s 36 rolls are shown in the histogram above.)
Dr. Free-Ride: So, you thought you might get three rolls that came up six.
Younger offspring: I actually rolled nine sixes.
Dr. Free-Ride: Why do you think it came up six more often than any other roll?
Younger offspring: I think it was luck. There are lots of games where rolling the highest number is good luck. The color red is also lucky.
 Dr. Free-Ride: Are you willing to roll some dice for me?
Elder offspring: Of course.
Dr. Free-Ride: First, can you make some predictions for me? We’re going to roll 36 times. How many of each number do you expect to roll?
Elder offspring: Let’s see, 36 divided by six … six of each number.
Dr. Free-Ride: You did that fast! How’d you make that prediction?
Younger offspring: Well, the die has six sides. And each of the sides is just the same except for what number is on it. So, the chances of getting any one side are just the same as the chances of getting any other.
Dr. Free-Ride: Do you know how to count cards yet?
Elder offspring: Huh?
Dr. Free-Ride: Never mind.
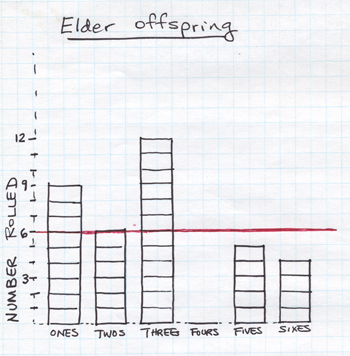
(The results of the elder Free-Ride offspring’s 36 rolls are shown in the histogram above.)
Dr. Free-Ride: Well, your prediction of how many rolls would come up as twos came true, but that was the only one.
Elder offspring: Hey, I rolled twelve threes and no fours!
Dr. Free-Ride: Do you think we should be worried that the actual results are so far from what you predicted?
Elder offspring: No. Each number had an equal chance of coming up on any of the rolls, but that doesn’t guarantee that you’ll see each number come up the same number of times.
 Dr. Free-Ride: Can you roll some dice for me? You just need to roll 36 times and I’ll write down the results.
Dr. Free-Ride’s better half: Why are you doing a grade-school probability exercise?
Dr. Free-Ride: What day of the week is it tomorrow?
Dr. Free-Ride’s better half: Friday.
Dr. Free-Ride: And?
Dr. Free-Ride’s better half: You need to write a Friday Sprog Blogging post. You know, there’s a calculation you can do to figure out how probably the frequencies you observe are, given a fair die. I don’t remember exactly what that calculation is, though.
Dr. Free-Ride: I can’t remember it either, but I know we used it to analyze rolls of dice for a Stat. Mech. problem set.
Dr. Free-Ride’s better half: You could try to find it.
Dr. Free-Ride: I’m not digging through the garage tonight.
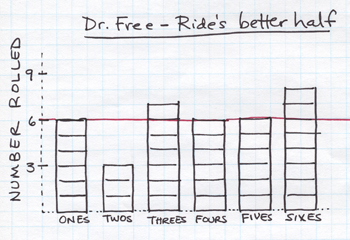
(The results of Dr. Free-Ride’s better half’s 36 rolls are shown in the histogram above.)
Dr. Free-Ride: That’s a nice distribution of rolls. The twos are a little low, but other than that, really close to what it should be.
Dr. Free-Ride’s better half: Don’t be accusing me of cheating on the twos.
Dr. Free-Ride: I’m not accusing!
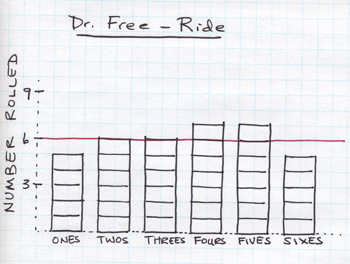 Here’s the histogram of my rolls.
I did not, in fact, have a dialogue with myself as I rolled the dice. Not even an internal dialogue. I just rolled and wrote down my results. I’m not sure what it means that my rolls and the rolls of my better half ended up generating frequencies that were closer to the predicted distribution of rolls than the sprogs produced with their rolls. I might have to observe individual dice-rolling technique more closely next time.
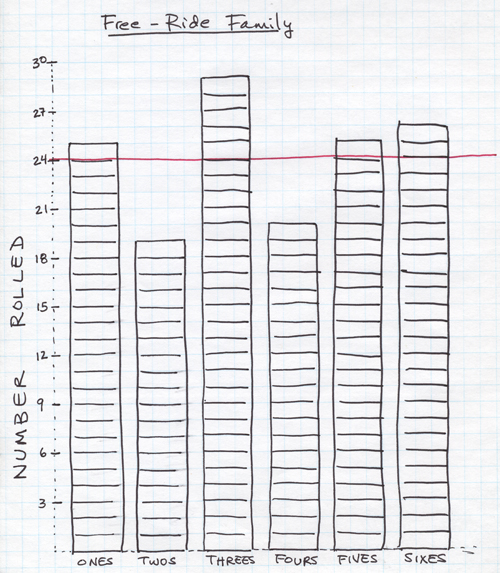
Pooling the data for the four of us brought the observed frequencies a bit closer to the predicted frequencies. Overall, the biggest departures were for twos (coming up 0.79 times per 6 rolls) and threes (coming up 1.21 times per 6 rolls). Compare this to the younger Free-Ride offspring’s observed frequencies for twos and threes (0.67 out of 6 rolls) and sixes (1.5 out of 6 rolls), the elder Free-Ride offspring’s observed frequencies for threes (2 out of 6 rolls) and fours (0 out of 6 rolls), and my better half’s observed frequencies for twos (0.5 out of 6 rolls) and sixes (1.33 out of 6 rolls). So, with more data the observed frequencies do seem to approach the expected frequencies.
Except my frequencies were pretty good. Pooling them with the other data actually dragged them farther away from the predicted frequencies. What should I make of that? Surely it’s not that I have more respect for prior probabilities.
Maybe “fair” is just how I roll.

Possibly Elder Offspring has a heretofore unknown bias against the #4! Look how it screwed the results!
I had a friend who, when we played risk, would turn all of the dice to ‘6’ before rolling. The rest of us would joke that it didn’t matter, but I always wondered about it. Is it more likely that the die will roll forward than sideways, given an average toss? Just because a die is ‘fair’ doesn’t mean the roll is 😉
I don’t know what the frequencies mean, but your choice of dice outs you as some sort of gaming geek. Someone in that house has played D&D. Who else would have purple transparent dice?
I wonder if individual dice might be accidentally biased towards rolling certain numbers? I don’t mean that they are weighed, but just that irregularities in the shape might lead to certain results being favoured.
A task for next week, perhaps? A few thousand rolls should sort it out…
Along that line, on the occasions when I’m getting clobbered in some dice game I find myself wondering if those indentations gouged out from the sides of dice might actually shift the center of mass enough to skew the outcome.
But only when I’m getting clobbered.
Looks like paddy’s concern and mine have been addressed and presented at the 6th Experimental Chaos Conference:
Experimentally obtained statistics of dice rolls
(They analyzed a mere 640,934 rolls.)
Over time, I’ve heard that indentations do change frequencies, so a lot of places (like vegas?) use painted dots instead.
Conclusions based on small n statistics are always suspect.
Astronomers tend to worry about that AFTER they have found phenomena with sample sizes larger that a few. Until then, they will do anything to try to extend their understanding of the new phenomena, including running statistics on only a few (I sometimes exagerate and say astronomers run statitics on anything they see 2 of). But astronomers have almost as much difficulty controlling their ability to make specific observations as some basic particle physicists.